How are speed limits determined?
The short answer
Speed limits are set using a combination of engineering calculations, real-world driving behavior, and crash data. The goal is to balance safety and mobility based on how roads are designed and how drivers actually use them.
The long answer
We've been trying to slow down speeding vehicles for hundreds of years.
One of the first speed limits ever was set way back in 1652. A law was issued in New Amsterdam (now New York) that stated that no "wagons, carts or sleighs shall be run, rode or driven at a gallop." The fine for breaking this speed limit was "two pounds flemish" (about $150 today).

New Amsterdam circa 1662: The birthplace of the speeding ticket
"AMH-6831-KB View of New Amsterdam" by Jacob van Meurs is part of the public domain.
Today speed limits are a bit more precise than a horse's gallop. Speed limits are set by a public authority based on recommendations from traffic engineers and members of the public.
The purpose of speed limits is to strike a balance between mobility and safety. The higher the speed limit, the faster drivers can get to where they need to go. But higher speeds also come with safety risks.
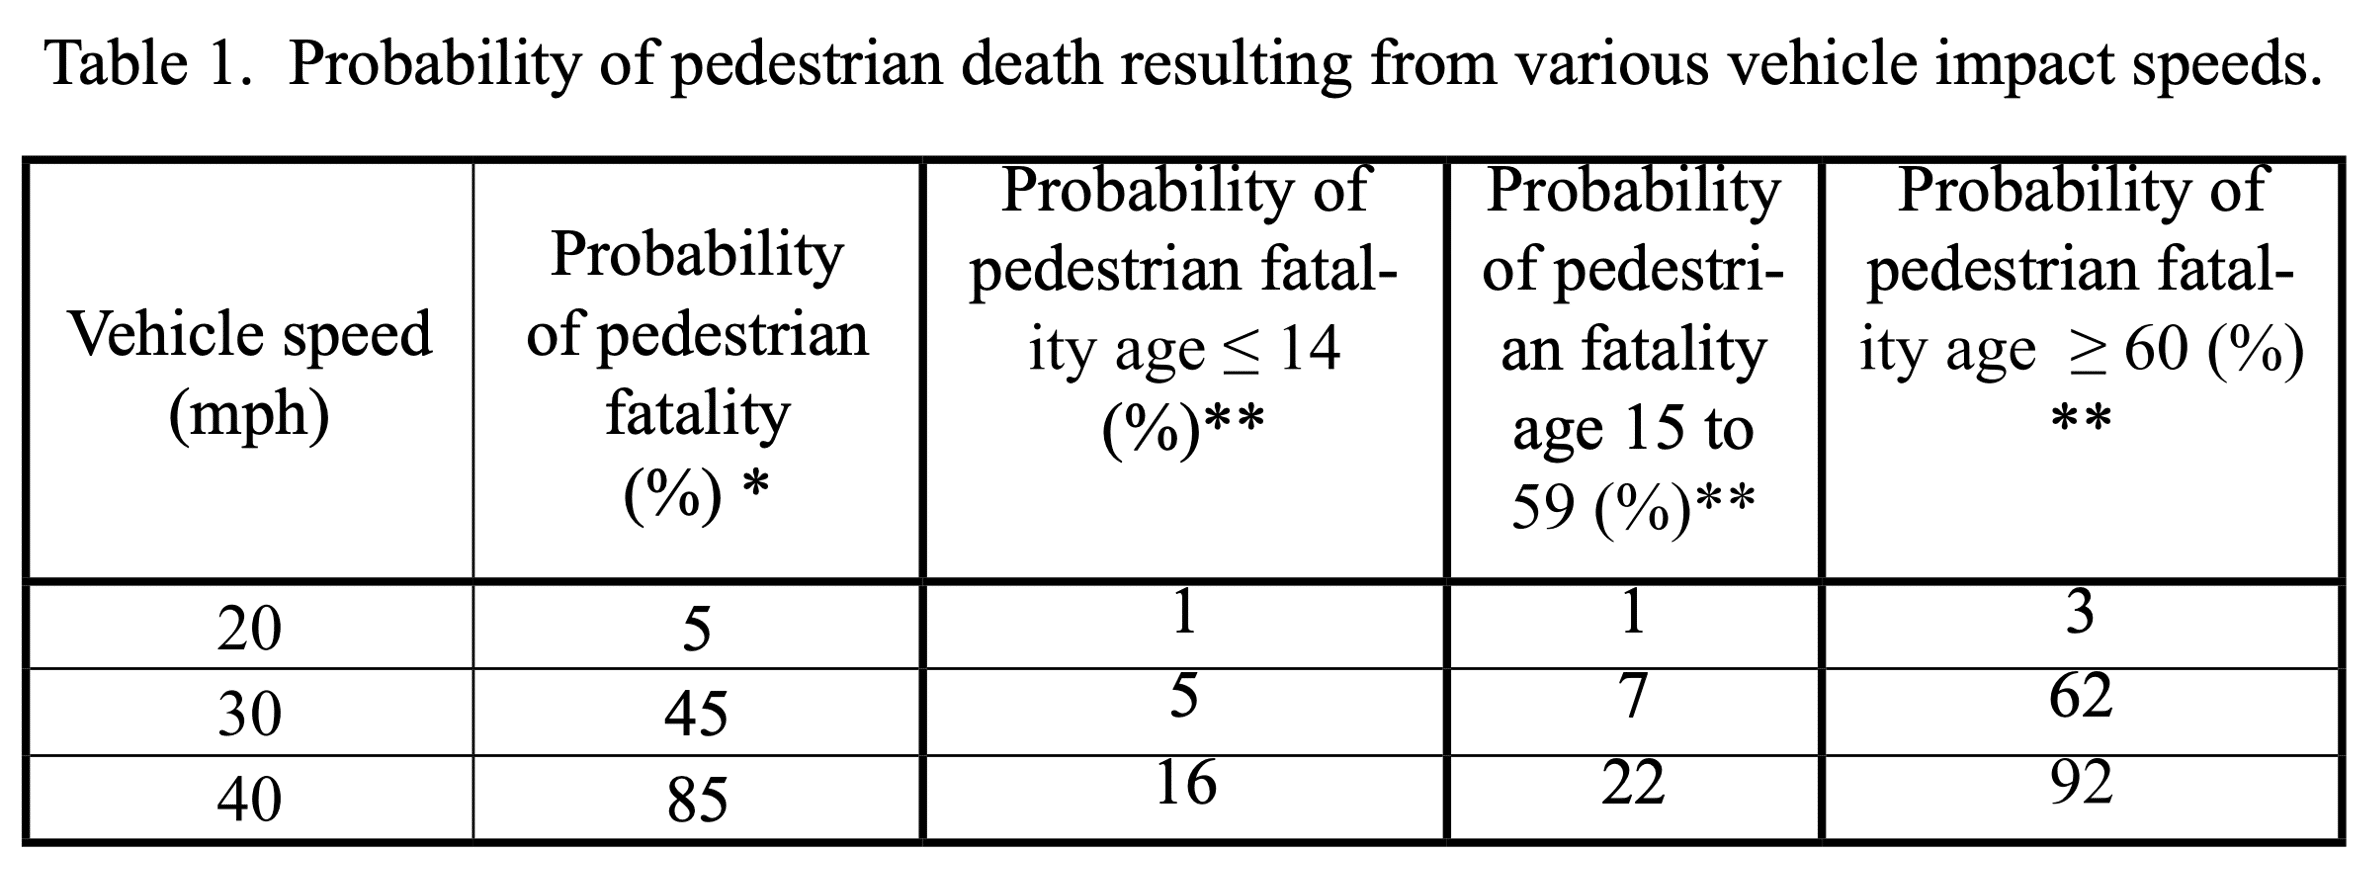
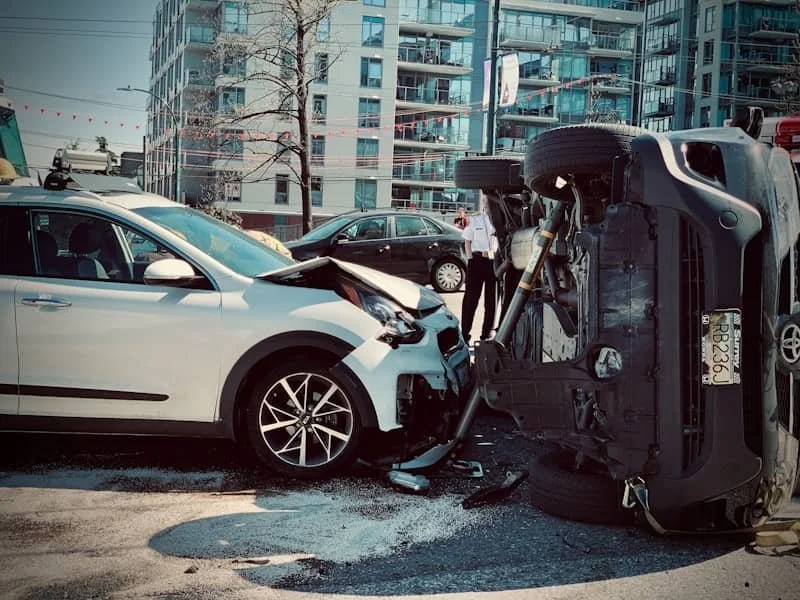
There is a strong correlation between higher speeds and accident severity: a 5% increase in average speed typically leads to a 10% increase in injury and 20% increase in deaths.
There's less consensus that faster speeds increase accident frequency, but real-world data suggests that lowering speed limits can reduce the number of crashes.
🇩🇪 In Germany, reducing a speed limit from 60 km/h to 50 km/h (37 mph to 31 mph) led to crashes declining by 20%.
🇦🇺 In Australia, reducing a speed limit from 110 km/h to 100 km/h (68 mph to 62 mph) led to injury crashes declining by 19%.
🇬🇧 In the U.K., reducing a speed limit from 100 km/h to 80 km/h (62 mph to 50 mph) led to crashes declining by 14%.
Here are the common steps governments take to determine a speed limit for a new road or highway.
Step 1: Conduct a speed study
Before a road is built, traffic engineers conduct a speed study to land on a "design speed," or how fast that the road is intended to be driven safely. They will review the land's topography, adjacent buildings, and road's intended use to calculate how fast a road can be while still being safe for drivers and pedestrians.
They'll ask questions like:
Is this road going to be used by commuters or locals?
How wide will the lanes and shoulders be?
Is the road going to be curvy or straight? Flat or hilly?
Will there be intersections or blind spots?
How tight can the curves be before they become unsafe at higher speeds?
How much should the road tilt on curves to help vehicles stay on track?
How long do off/on-ramps need to be for drivers to adjust speed safely?
A lot of these questions come down to how much a driver can see and how quickly they can react. For example, as a car goes faster, the driver has less peripheral vision and needs more distance to come to a complete stop.
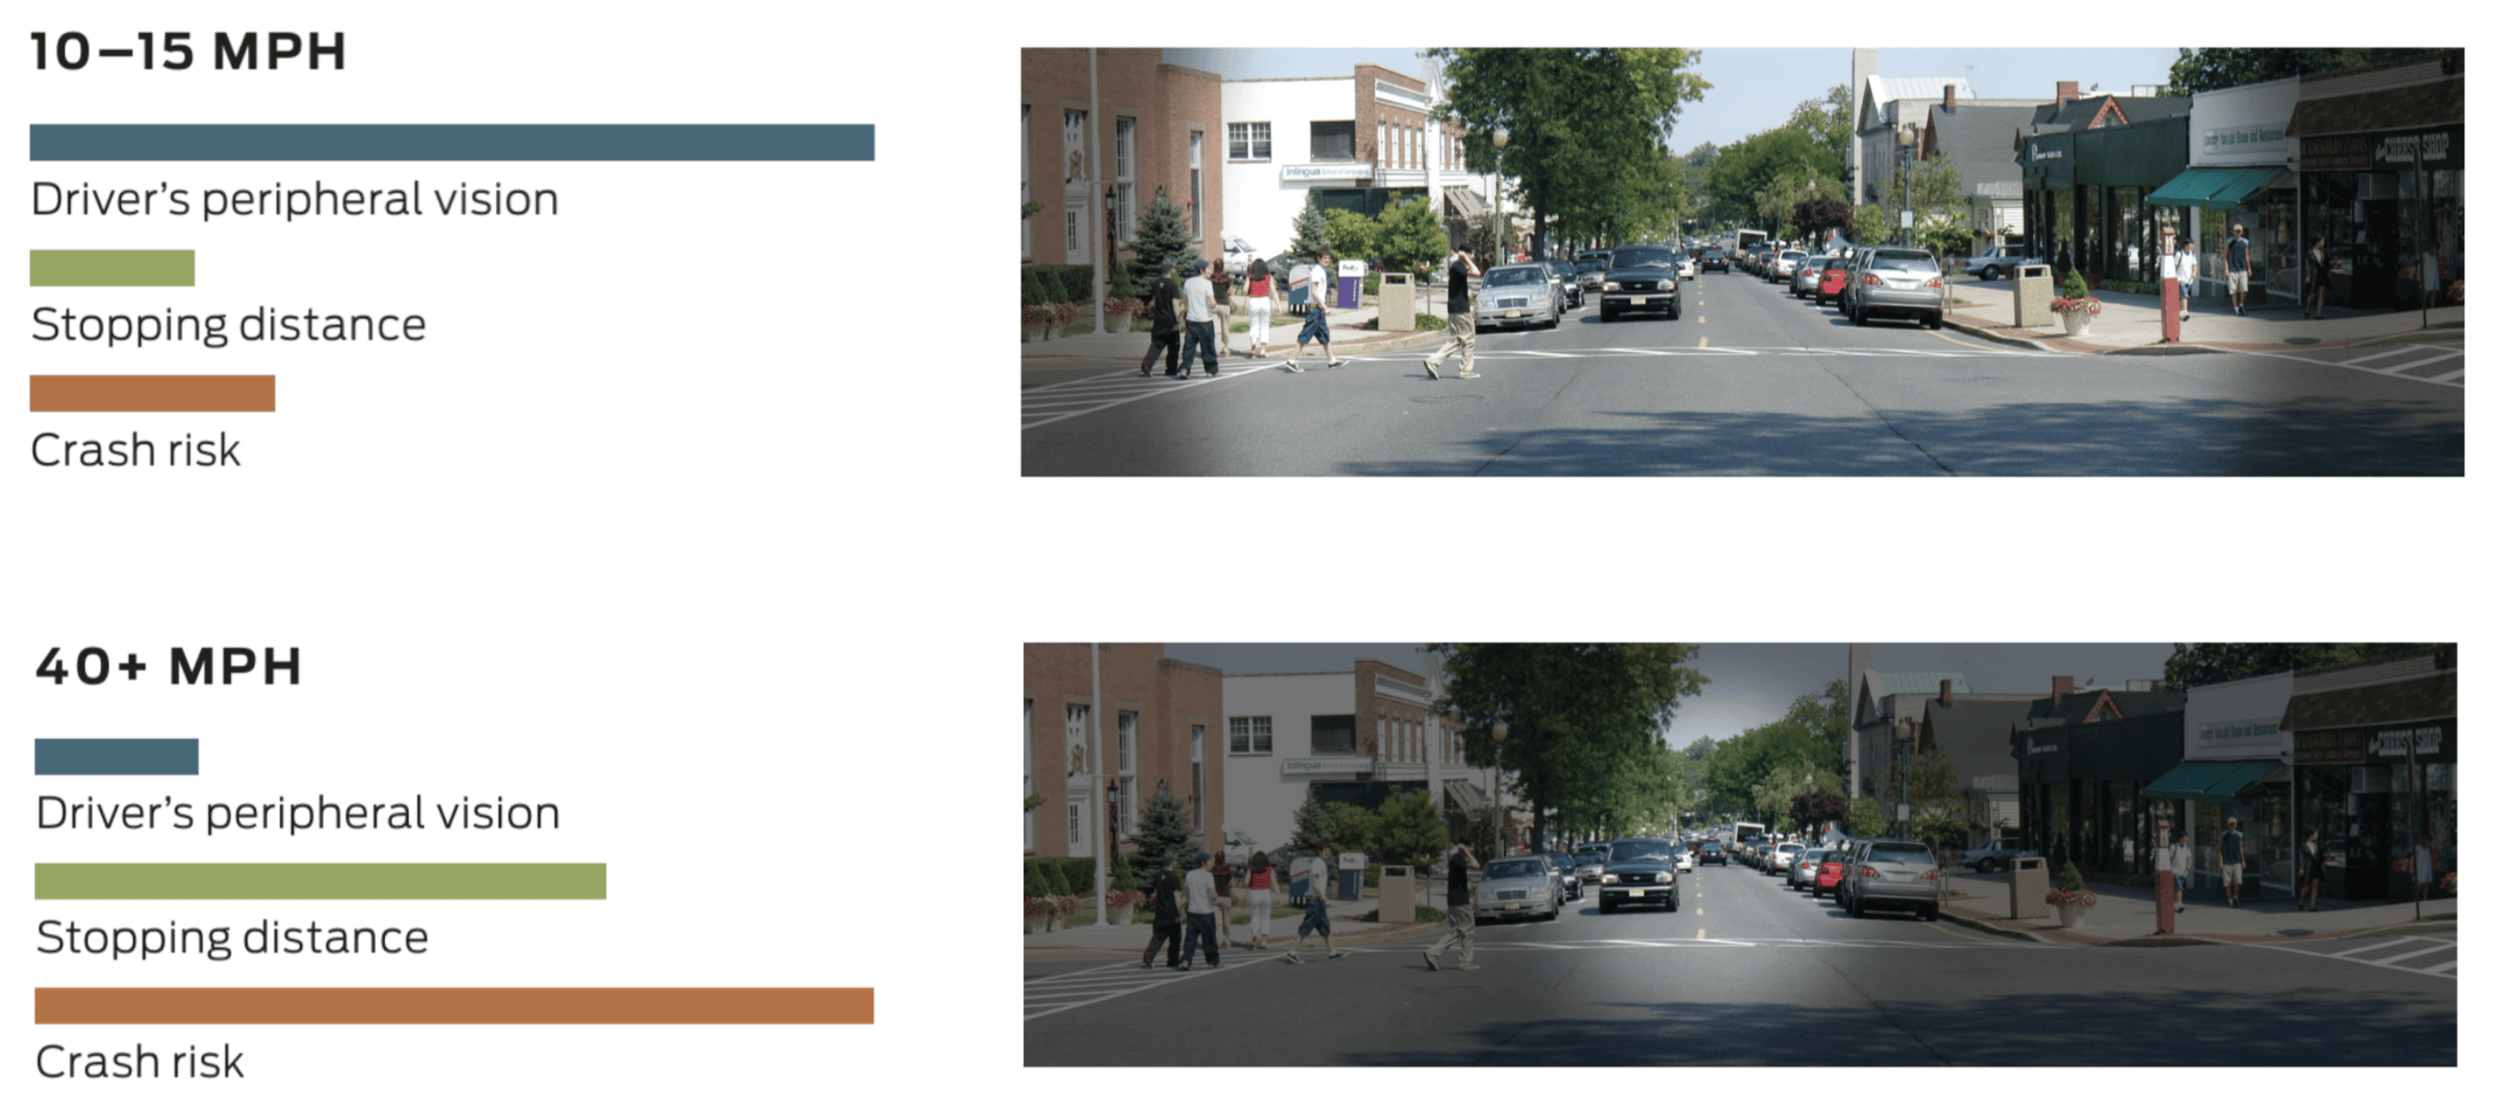
Source: NACTO
Traffic engineers will use a lot of mathematical calculations to determine the safest speed for a particular road. Each geometric element of a road (curve radius, slope, etc.) has a corresponding formula that can answer, "At what speed does this feature remain safe?"

"Historic Columbia River Highway - Hairpin Curve on the Rowena Loops - NARA - 7719276" is part of the public domain.
For example, here's the equation that shows the relationship between a curve's radius and the design speed:
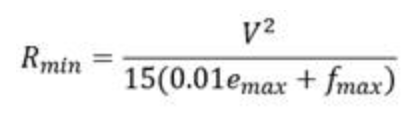
In plain English:
Rmin = the minimum radius (how tight the curve can be)
V = design speed
emax = maximum percent of roadway superelevation (how much the road tilts into the curve)
fmax = maximum side friction factor (the grip between tires and pavement)
So if a road's curve radius is 1,200 ft (366 m), the superelevation is 6%, and the side-friction factor is 0.14, then the maximum safe speed is 60mph (97 km/h).
Traffic engineers will run equations like this for every feature in the road, like sight distance, vertical curves, and hill grades.
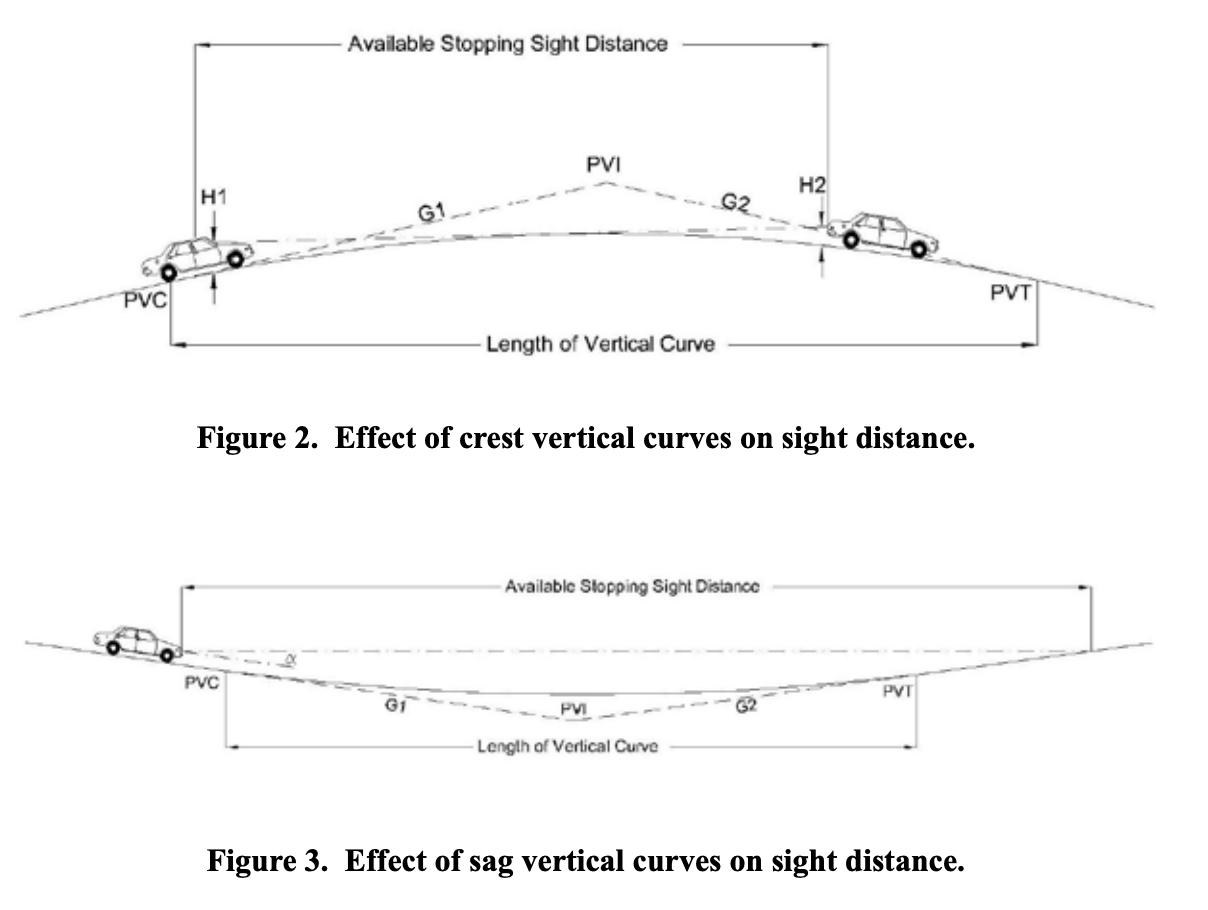
After these calculations are complete, the lowest maximum speed will often dictate the design speed of that road. So if your road's curve can be 65 mph (105 km/h) but your sight distance is only 55 mph (89 km/h), then the design speed will be set at 55 mph.
But the design speed isn’t always the final posted speed limit. Other factors like actual driver behavior and crash history also come into play.
Step 2: Calculate the 85th percentile speed
Once the design speed is set and the road is open, it's time to wait and see how fast drivers actually drive on the road. Traffic engineers will run a traffic count to collect data on the actual quantity of vehicles and their average speed.
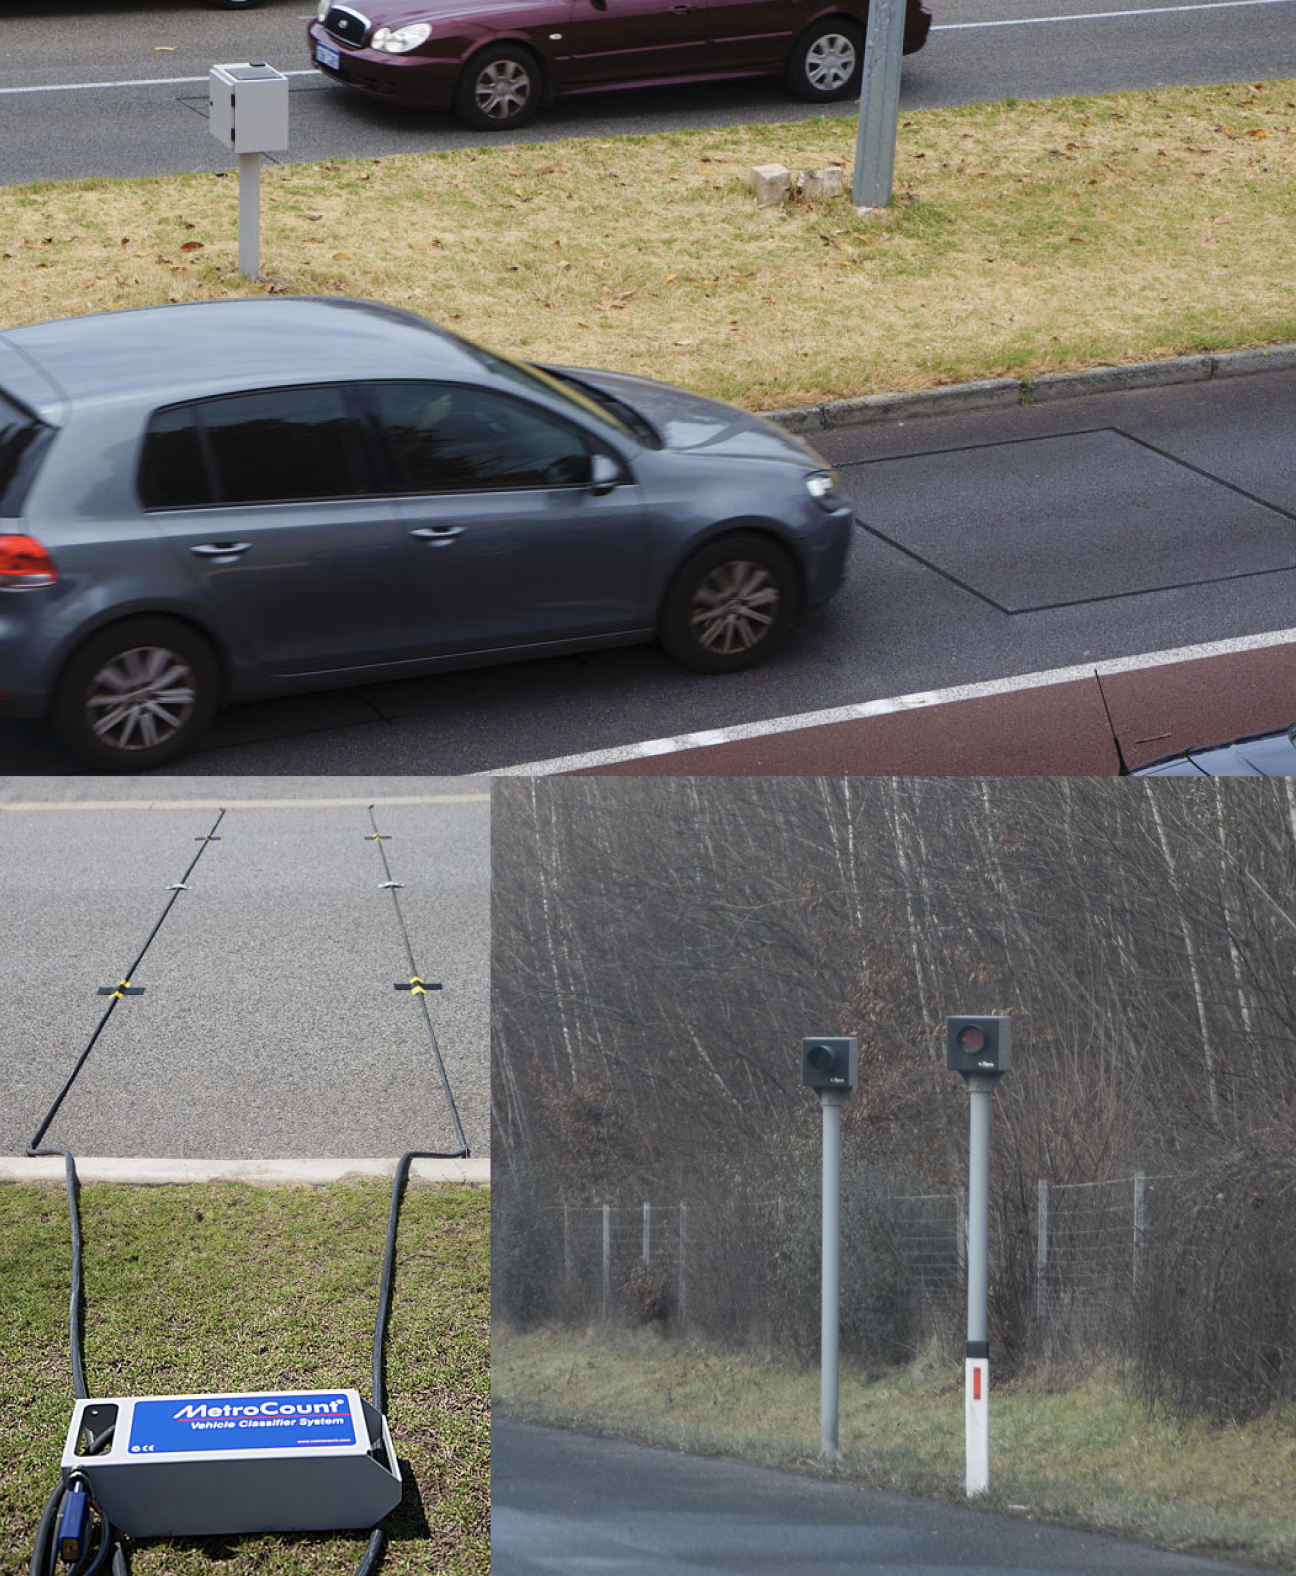
A traffic count measures the quantity and speed of vehicles traveling down a road. This can be done using inductive loop detectors embedded in the pavement (top), pneumatic road tubes (left), or radar detectors (right).
Top: "Inductive Loop Traffic Counter" by Louis van Senden is licensed under CC BY-SA 4.0. Left: "MetroCount Pnuematic Tube Traffic Counter" by Louis van Senden is licensed under CC BY-SA 4.0. Right: "Front Radar Süd Autobahn A2 in Styria Speed cameras in Austria" by Nxr-at is licensed under CC BY-SA 4.0.
This data is then analyzed to determine the 85th percentile speed, or the speed at which 85% of traffic tends to travel at or slower.
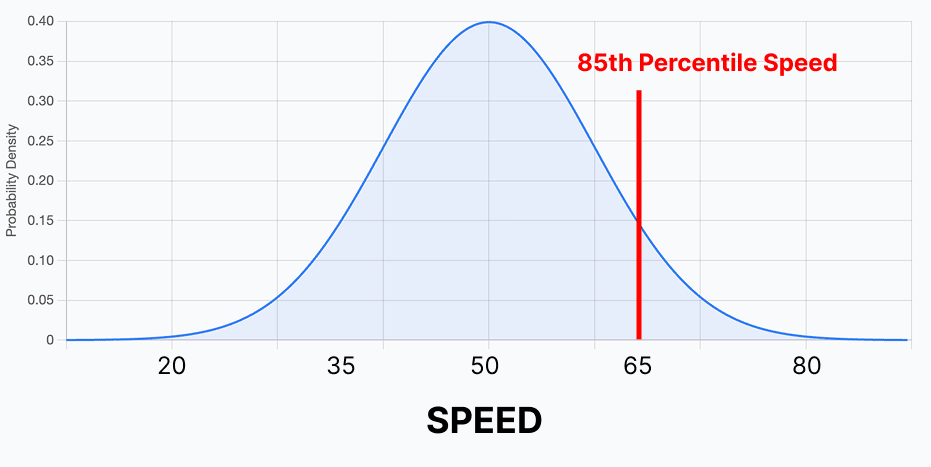
The theory behind the 85th percentile traffic speed principle is based on the idea that driving behavior is an extension of one's social attitude. Since the majority of drivers tend to drive safely, the actions of a reasonable individual should be the basis for the law.
Some disagree with this principle, which is derived from a 1964 study solely based on observations of rural roads, not urban areas. And since the 85th percentile speed is based on how fast drivers feel comfortable driving, it necessarily doesn't account for pedestrian or bicyclist safety.
That's, in part, why more modern speed limit assessments also take into consideration more factors like history of recent accidents on that road.
Step 3: Perform an accident review
After assessing the 85th percentile speed, traffic engineers will also review data on the rate of collisions on the road, compared to the overall rate in the local area. This is often reported as a number of crashes per million miles traveled.
Step 4: Submit speed limit recommendation
In addition to engineering data, traffic engineers must also consider legal constraints, like state minimum or maximum speed limits and local zoning rules, such as whether the area is residential, school-adjacent, or zoned for heavy pedestrian use.
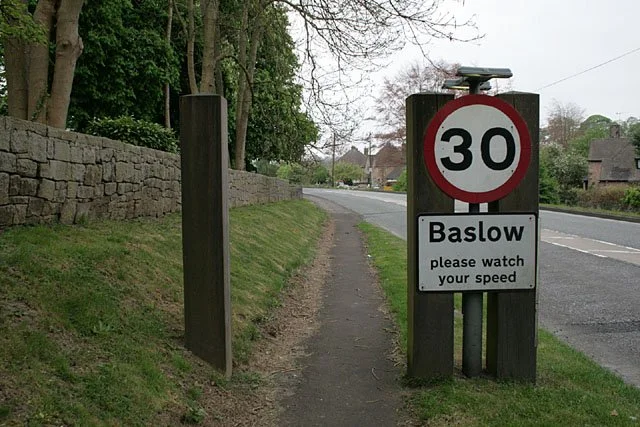
A very polite speed limit sign
"Speed limit sign" by David Lally is licensed under CC BY-SA 2.0.
Taking those existing laws into consideration, along with plenty of data on the road's characteristics from the design speed study, the 85th percentile speed, the frequency of collisions, traffic engineers will begin to form a recommendation for a new speed limit, if needed:
If crash rates are low and the 85th percentile is around the existing speed limit, the engineer may recommend keeping the speed limit the same.
If crash rates are low, the 85th percentile speed is higher than the existing speed limit, and the road design can handle higher speeds, the engineer may recommend increasing the speed limit.
If crash rates are high and the 85th percentile speed is near an existing speed limit, the engineer may recommend a speed limit reduction.
If crash rates are high and the 85th percentile speed is higher than the existing speed limit, the engineer may stick with the speed limit but recommend more law enforcement or geometric features to reduce drivers' speed naturally, like speed humps, feedback signs, or roundabouts.
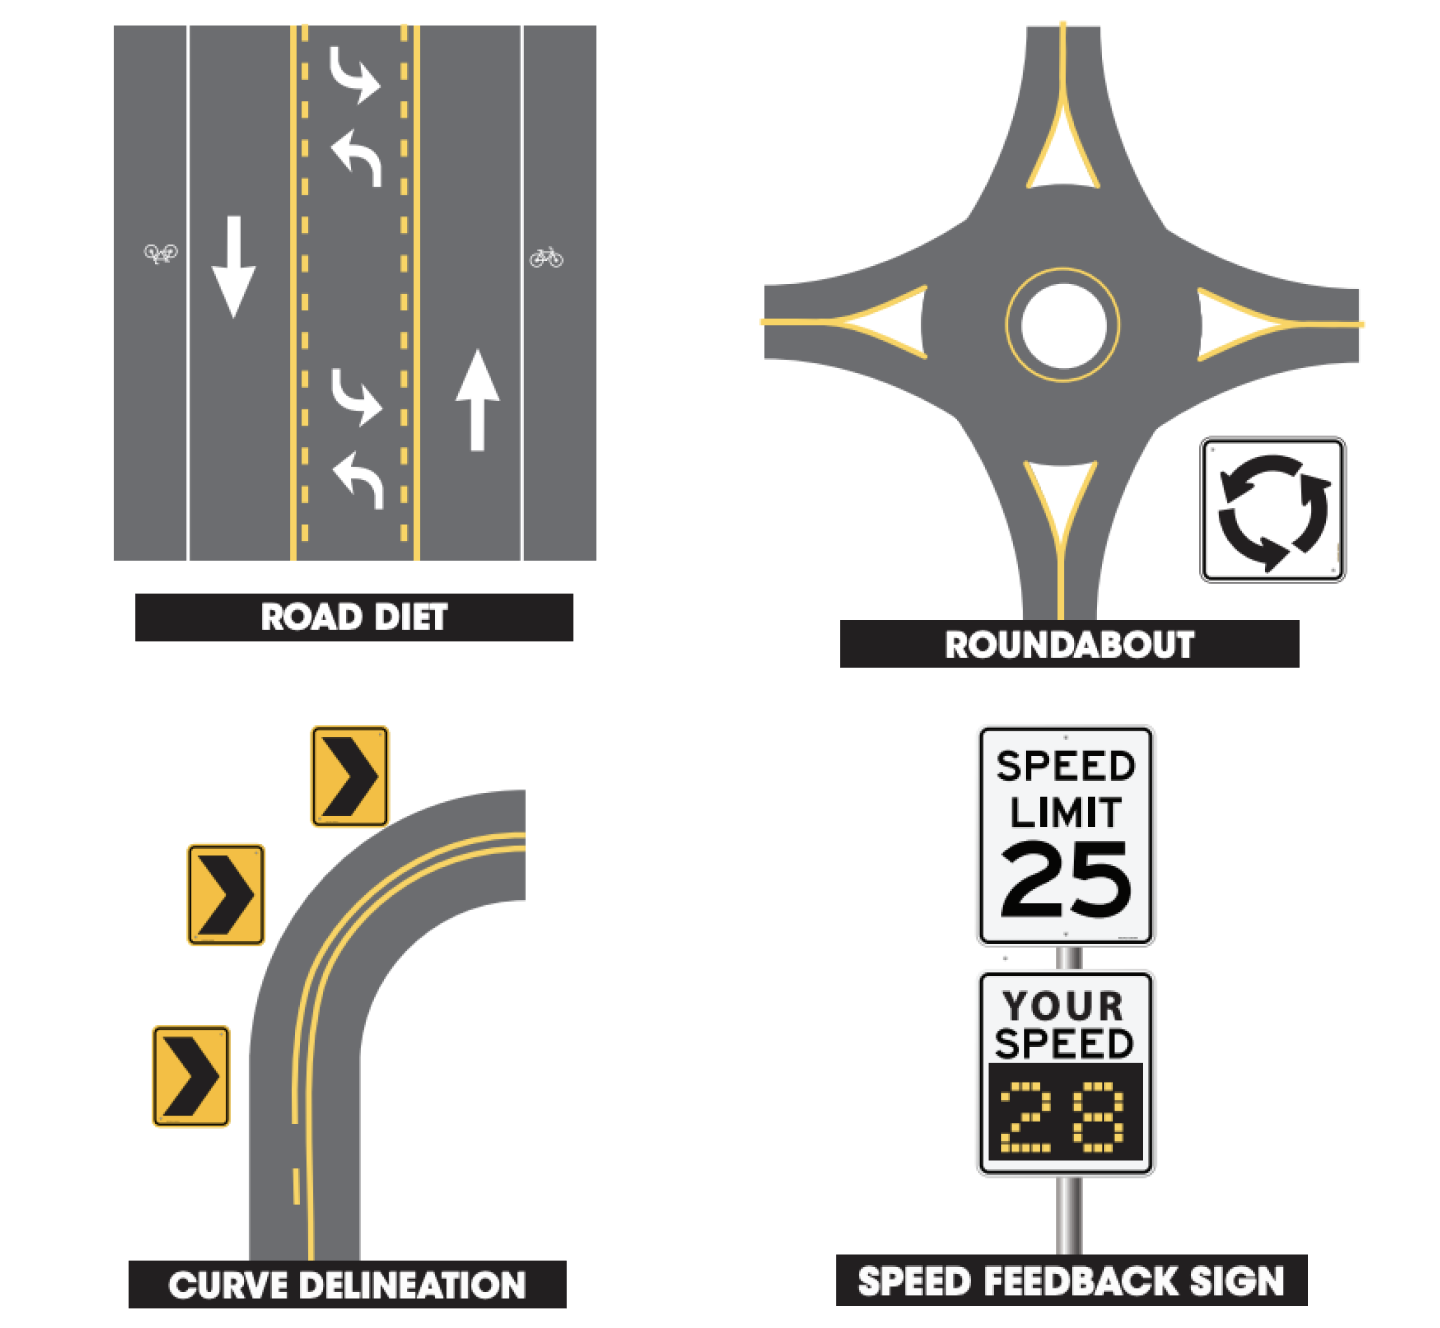
Examples of speed-reduction features traffic engineers implement to naturally slow down drivers.
Source: U.S. Department of Transportation
🧠 Bonus brain points
What is the difference between a speed bump and a speed hump?
I honestly thought these terms were interchangeable until I came across this diagram in a U.S. Department of Transportation resource.

A speed hump is more gradual and found on public roads and streets, whereas a speed bump is more abrupt and typically used on private driveways and parking lots.
Speed humps are often used in residential and school zones and cause drivers to reduce their speed to 15-20 mph (24-32 km/h). Speed bumps are more jarring to drive over, so drivers will speed down to 5-10 mph (8-16 km/h).
Curious about how the world works?
Today You Should Know is a free, weekly email newsletter designed to help you learn something new every Friday.
Subscribe today 👇
Check out some other curious questions:


Sources
Arizona Department of Transportation. (n.d.). Establishing Speed Limits. Arizona Department of Transportation. https://azdot.gov/business/engineering-and-construction/traffic/faq/establishing-speed-limits
Bagdade, J., Nabors, D., McGee, H., Miller, R., & Retting, R. (2012, November). Speed Management: A Manual for Local Rural Road Owners. Federal Highway Administration. https://highways.dot.gov/sites/fhwa.dot.gov/files/2022-06/fhwasa10001.pdf
Donnell, E., Hines, S., Mahoney, K., Porter, R., & McGee, H. (2009, September). Speed Concepts: Informational Guide. Federal Highway Administration . https://highways.dot.gov/sites/fhwa.dot.gov/files/2022-06/fhwasa10001.pdf
Khayesi, M., Eichinger-Vill, E., Turner, B., & Burlacu, A. (2023). Speed Management: A road safety manual for decision-makers and practitioners (2nd Edition). World Health Organization. https://cdn.who.int/media/docs/default-source/documents/health-topics/road-traffic-injuries/3146-wbk-speed-mgmt-2nd-edition-131023-electronic.pdf?sfvrsn=696ed45e_3
McFadden, C. (2019, November 17). How Exactly Are Speed Limits Calculated?. Interesting Engineering. https://interestingengineering.com/science/how-exactly-are-speed-limits-calculated
Seeker. (2016, May 6). How Do We Decide Speed Limits?. YouTube. https://www.youtube.com/watch?v=w83O6jP1BB4
Sánchez, V. (2025, May 25). ‘So Much Death’: Lawmakers Weigh Stricter Speed Limits, Safer Roads for Pedestrians. U.S. News. https://www.usnews.com/news/health-news/articles/2024-05-25/so-much-death-lawmakers-weigh-stricter-speed-limits-safer-roads-for-pedestrians
Traffic Safety Warehouse. (n.d.). Speed Bumps vs. Speed Humps. Traffic Safety Warehouse. https://www.trafficsafetywarehouse.com/Resources/speed-bumps-vs-speed-humps.asp
U.S. Department of Transportation . (2018, January). Self-enforcing roadways: A guidance report. Federal Highway Administration. https://www.fhwa.dot.gov/publications/research/safety/17098/004.cfm
U.S. Department of Transportation . (2023, December). Manual on Uniform Traffic Control Devices for Streets and Highways 11th Edition. Federal Highway Administration . https://mutcd.fhwa.dot.gov/pdfs/11th_Edition/mutcd11thedition.pdf
U.S. Department of Transportation. (1998, July 1). Synthesis of Safety Research Related to Speed and Speed Management. Federal Highway Administration Research and Technology. https://www.fhwa.dot.gov/publications/research/safety/98154/speed.cfm
US Department of Transportation . (n.d.). Speed Management Countermeasures. Federal Highway Administration . https://highways.dot.gov/media/13916
We Americans sure do like American things.